


Smaller reporting companies occupy an interesting corner of the SEC registrant universe. They are subject to reduced disclosure requirements, but they still carry real compliance costs, audit fees among them. The question of what those fees actually look like, and how they compare to the rest of the market, is one our data answers clearly.
Using data from the 2026 Who Audits Public Companies report, which covers 6,286 SEC registrants as of February 17, 2026, we looked at all 2,582 registrants carrying an SRC designation in some form. That includes companies filing as non-accelerated filers with SRC status, accelerated filers with SRC status, and standalone SRC filers. Together they represent about 43% of the non-SPAC registrant population, and their fee profile looks meaningfully different from the rest of the market.
The headline numbers
The median audit fee across all SRC-flagged registrants is $270,231. The mean is considerably higher at $505,222, pulled upward by the 247 accelerated filers that also carry SRC status. Of the 2,582 SRC-flagged companies in the population, 2,473 had audit fee data available in their SEC filings.
| Median audit fee | Mean audit fee | SRC-flagged registrants |
|---|---|---|
| $270K All SRC-flagged registrants |
$505K Pulled up by AF&SRC companies |
2,582 43% of non-SPAC population |
The gap between median and mean reflects how widely fees vary across the SRC subtypes. The 247 accelerated filers carrying SRC status have a median fee of $1,007,826, well above the overall figure, while the 187 standalone SRC filers sit at a median of just $49,169, a population small and distinct enough that it is discussed separately below rather than folded into the paired comparisons.
Emerging growth company (EGC) status also plays a role. SRC-flagged companies with EGC designation had a median audit fee of $241,000, compared to $286,368 for non-EGC SRC registrants, a difference of 15.8%, or about $45,000. That gap likely reflects simpler financial structures, shorter operating histories, and auditor pricing that accounts for the longer-term client relationship potential of an early-stage company.
Data note: All figures are drawn from SEC filings disclosed by registrants and compiled in the Ideagen Audit Analytics Cleaned Auditor Engagements database. The SRC-flagged population covers three material subgroups: Non-Accelerated Filer and SRC (2,147 companies), Accelerated Filer and SRC (247), and Smaller Reporting Company standalone (187). There is also one Large Accelerated Filer with SRC status in the population; given that single observation it is excluded from subtype analysis but is included in all-SRC aggregate figures, which marginally affects the overall mean. SPACs are excluded throughout. Fee calculations are based on 2,473 registrants with reported audit fee data.
Where fees fall across the distribution
Audit fee distribution — all SRC-flagged registrants
Percentage of 2,473 SRC-flagged filers with reported audit fees, by fee range
Fee Range |
Number of Filers | % of Total |
|---|---|---|
| Under $25K | 214 | 8.7% |
| $25K–$50K | 166 | 6.7% |
| $50K–$100K | 264 | 10.7% |
| $100K–$250K | 532 | 21.5% |
| $250K–$1M | 980 | 39.6% |
| $1M+ | 317 | 12.8% |
| Total | 2473 | 100.0% |
.png)
Audit fee distributions - All SRC-flagged registrants
The largest single bucket, nearly 40% of the population, sits in the $250,000 to $1 million range. That is where the bulk of the NAF & SRC companies land: businesses with enough scale to generate real audit work but not enough to push into accelerated filer territory. Another 12.8% are paying over $1 million, driven primarily by the AF & SRC group. At the other end, standalone SRC filers account for most of the under-$50,000 segment, about 15% of the overall SRC-flagged population pays less than $50,000, a reflection of genuinely simpler audit scope at that end of the market.
How SRC fees compare to the broader market
The clearest way to show the fee impact of SRC status is to pair each SRC subtype directly against its non-SRC equivalent. The two charts below do exactly that: accelerated filers alongside AF & SRC companies, and non-accelerated filers alongside NAF & SRC companies. Large accelerated filers are not shown: with only one LAF & SRC registrant in the population, a meaningful paired comparison is not possible at that tier.
Accelerated filer audit fees
Median audit fee — AF vs AF & SRC
| AF&SRC pays 25.5% less | |
|---|---|
| Filer Type | Median Audit Fee ($) |
| AF | $1,353,620 |
| AF&SRC | $1,007,826 |
.png)
Accelerated filer audit fees - Median audit fee
Non-accelerated filer audit fees
Median audit fee — NAF vs NAF & SRC
| NAF&SRC pays 7.7% less | |
|---|---|
| Filer Type | Median Audit Fee ($) |
| NAF | $283,950 |
| NAF&SRC | $262,000 |
.png)
Non-accelerated filer audit - Median audit fee
The fee reduction associated with SRC status is real at both tiers, but the size of the gap tells an important story. At the accelerated filer level the difference is 25.5%, or nearly $346,000 in median fees. At the non-accelerated level it shrinks to 7.7%, or about $22,000. That compression suggests the audit complexity driving most of the NAF fee level is not significantly different between SRC and non-SRC companies in that category. The SRC designation at the NAF tier may reflect revenue or float characteristics more than actual differences in audit scope.
Standalone SRC filers sit in a different league entirely. At a median of $49,169, roughly 95% below the AF & SRC median, they represent a genuinely distinct market segment where the audit is tightly scoped and the auditor mix looks nothing like the rest of the population.
Who is auditing SRC-flagged companies
The auditor landscape for SRC-flagged registrants is more balanced than you might expect from a "smaller" company designation, but still skews away from the Big Four. Other firms, including regional, specialized, and smaller practices, account for 55.2% of the SRC-flagged population. Mid-tier firms hold 23.8%, and the Big Four audit 21.0%.
| Auditor Category | Count | Market Share |
|---|---|---|
| Other firms | 1425 | 55.2% |
| Mid-tier | 615 | 23.8% |
| Big Four | 542 | 21.0% |
| Total | 2582 | 100.0% |
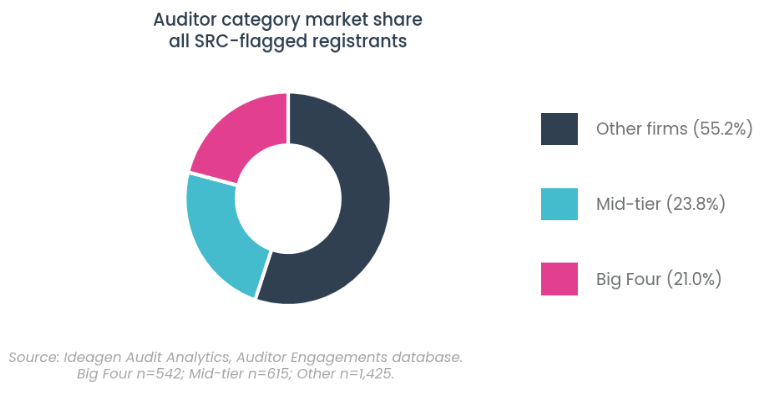
Auditor category market share all SRC-flagged registrants
Compare that to the overall non-SPAC market, where the Big Four hold 51% of registrant clients, more than double their 21% share in the SRC space. Mid-tier firms, including Baker Tilly, BDO, CBIZ, Grant Thornton, and others, are proportionally more active here than anywhere else in the market, a reflection of both their competitive positioning and the fee levels that make SRC engagements viable for them.
Audit fees by tier reflect the complexity gradient clearly. Big Four-audited SRC-flagged companies carry a median fee of $883,740 and a mean of $1,138,520, concentrated among the AF & SRC companies with more complex financial profiles. Mid-tier firms show a median of $459,294 and mean of $617,556. Other firms, serving the majority of the population, have a median of $117,500 and a mean of $209,263. The ratio between Big Four and Other firm median fees within the SRC population (about 7.5 to 1) is significantly wider than what you see in the large accelerated filer market, where complexity is more uniform and Big Four dominance compresses the range.
What this means for smaller public companies
The SRC designation covers a wide range of companies, and the fee data reflects that. A standalone SRC paying $49,000 for its audit and an accelerated filer with SRC status paying over $1 million share a regulatory classification but very little else in terms of audit economics. That breadth is important context for any analysis that treats the SRC population as a single group.
Life sciences is the largest industry segment in the SRC-flagged population with 505 companies, followed by trade and services (372), industrial applications and services (319), and technology (314). Life sciences companies are notable because they often carry disproportionate audit complexity relative to their revenue. Clinical-stage companies with no commercial income but significant non-cash transactions, R&D accounting questions, and milestone recognition issues. Their concentration in the SRC population helps explain why the overall fee distribution has more weight in the upper ranges than the "smaller" label might suggest.
For companies approaching any of the SRC threshold boundaries, whether gaining the designation as they contract or losing it as they grow, the fee trajectory is worth modelling in advance. The 25.5% gap between AF and AF & SRC medians, and the narrower 7.7% gap at the NAF level, suggest the financial impact of the designation varies considerably depending on where a company sits in the filer hierarchy. The full 2026 report provides the breakdown by filer type, region, industry, and auditor that makes that kind of benchmarking possible.

Download the full 2026 report
The complete Who Audits Public Companies report covers market share, fee trends, and auditor breakdowns across filer status, exchange, industry, jurisdiction and US region.
Explore audit and regulatory disclosure data
Expert data you can trust – and find within seconds. Your go-to place for public accounting, governance and disclosure intelligence.