



A risk matrix is a simple, visual tool for working out how serious a risk is by scoring its likelihood and its consequences. It has limitations, partly because of that simplicity, but also clear benefits. For risk managers and senior leaders alike, it gives an accessible overview of the risks your organisation faces and makes it easier to decide how to deal with them.
In this blog, we explain what a risk matrix is, how it relates to a risk register and a risk heat map, weigh up the pros and cons, and show how to create and use one.
What is a risk matrix?
A risk matrix is a grid that plots the likelihood of a risk against the severity of its consequences, giving each risk a rating so you can compare and prioritise them. It helps you understand the risks your organisation faces in a visual way. How does it do this?
Risk matrices all follow the same basic structure. They are typically 5x5 grids that show the likelihood of risks occurring along the Y axis and the severity of their consequences along the X axis. Each axis follows a scale of very low to very high. The risks that your organisation could face are placed within the risk matrix depending on where they fall on this scale. This helps you determine levels of risk.
Likelihood x Consequence = Level of Risk
If the risk is high on the likelihood scale and high on the consequence scale, you can define the level of risk as very high. Conversely, if the risk falls low on the likelihood scale and low on the consequence scale, the level of risk would be very low.
Within a risk management matrix, levels of risk are further highlighted with a colour-coded system. A low-rated risk is colour-coded green. If it is medium, it is shown in yellow or orange. An overall high risk is depicted in red. This traffic light system makes it easy to quickly understand levels of risk.
Despite this basic structure, a risk severity matrix can vary greatly depending on your organisation and how you use it.
For example, the likelihood axis can be divided into more specific categories such as 'certain', 'likely', 'possible', 'unlikely' and 'rare'. Categories along the consequence axis could be called 'very low', 'low', 'medium', 'high', and 'extreme' or 'catastrophic'. How you label these categories is entirely up to you.
Let's take a look at a risk matrix example.
Examples of a risk matrix
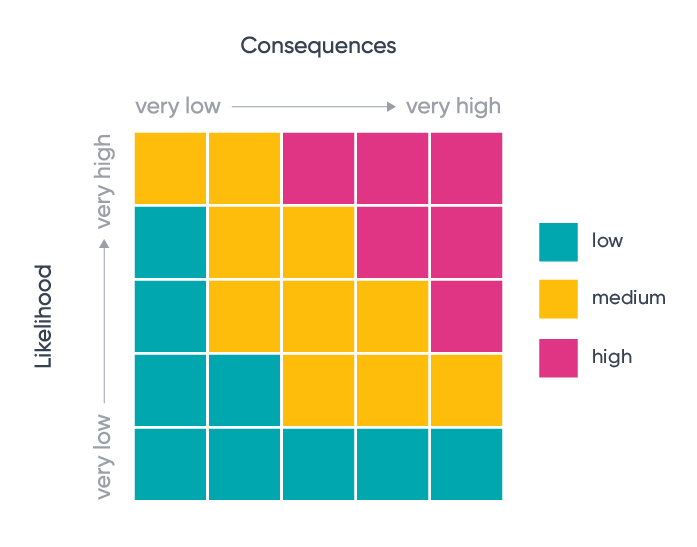
As you can see, the risk matrix is a fairly simple tool, although it can be made more complex depending on how you choose to use it within your organisation.
Imagine you are conducting a risk assessment for your day-to-day life. There are plenty of risks we could face each day, many we don't even think about. Some risks from ordinary activities could be:
- Reading – getting a papercut
- Travelling – having a car accident
- Eating – getting food poisoning
You might input these risks into the risk matrix as follows:
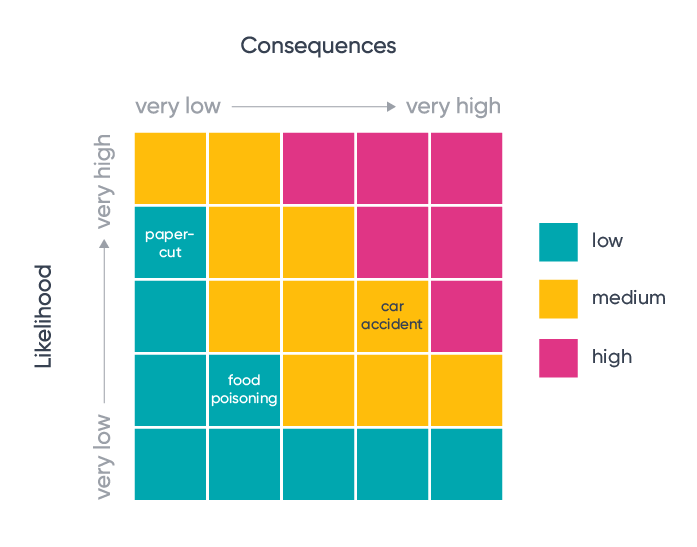
Papercuts are certainly a possibility while turning the pages of your reading material. But since they won't cause you any serious harm, the overall risk remains low – it's not going to stop you from picking up that book, or from doing paperwork.
Food poisoning might be less likely (unless, perhaps, cooking isn't your forté), but the consequences could be more severe. Still, you're unlikely to end up in hospital and the risk isn't going to stop you from making your dinner. You might just be more careful to cook everything properly.
Then there is the possibility of a car accident. If this is a major incident, the consequences would be far worse than either a papercut or a stomach upset. For that reason, the overall risk is medium. That's why we need driving licences, insurance, and seatbelts. In other words, actions that seek to mitigate the risk.
As you can see from these examples, where risks are placed within the risk matrix depends greatly upon context. It is therefore important to thoroughly analyse risks and understand your organisation's individual circumstances, so that you can evaluate levels of risk as accurately as possible.
Think about some of the risks your organisation faces. Where would you place these on the risk matrix?
What is a risk assessment matrix and 5x5 risk matrix?
You may have heard the phrases 'risk assessment matrix' or '5x5 risk matrix'. If you have ever wondered what these are, and if they differ from a simple risk matrix, you will be glad to know that they are all one and the same.
Because a risk matrix is used during the risk assessment process, it is sometimes referred to as a risk assessment matrix. The tool assesses risks by looking at their likelihood and consequences.
A 5x5 risk matrix simply refers to a risk matrix that is made up of 5 cells along the X axis and 5 cells along the Y axis. Essentially, a 5x5 grid. A risk matrix does not have to be 5x5, although this is the most common type.
What is a risk heat map?
A risk heat map is a colour-coded visual of your risks, usually a risk matrix with your individual risks plotted on it. The colours run from green through yellow or orange to red, so the highest risks stand out at a glance.
The two terms are closely linked and often used interchangeably. The risk matrix is the scoring framework. The heat map is that framework populated with your real risks. Many organisations produce one heat map showing risk before controls are applied and another showing risk after, so the effect of those controls is clear.
Heat maps are popular in board and committee reports because they show your whole risk profile on one page. Like the matrix, they only show a point in time, so they need refreshing as your risks change.
What is a risk register?
A risk register is a central record of the risks your organisation has identified, along with the information you need to manage each one. It is usually a table or database with one row per risk.
A typical entry includes:
- A description of the risk and its category
- A named risk owner
- Likelihood and consequence scores
- The overall risk rating, taken from your risk matrix
- Existing controls and planned mitigation actions
- Status and next review date
The three tools work together. The register holds the detail, the matrix scores each risk and the heat map shows the results visually. A matrix without a register tells you how serious a risk is, but not who is dealing with it or what is being done.
Registers kept in spreadsheets tend to go out of date, especially across several teams or sites. Risk management software keeps your register, scoring and reporting in one place.
How to create a risk matrix
Creating a risk matrix contains similar steps to a standard risk management process.
- Identify the risks – What events could prevent your organisation from achieving its objectives, or bring harm to your business, employees, customers, or other stakeholders?
- Evaluate the risks – This is where the risk matrix really comes into play. At this stage, you need to assess the likelihood or frequency of risks, as well as their severity. Would the consequences be catastrophic, or a trivial inconvenience?
- Input the risks into your matrix and record them in your risk register – Now that risks have been identified and assessed, plotting them on the matrix and logging them in your register will help you prioritise and treat them.
- Monitor the risks – Risks and levels of risk are not guaranteed to stay the same once they are inputted into the risk matrix. Since risk management is a continuous process, you will need to update the risk matrix to make sure it is accurate.
How to use a risk matrix
So, you've made a risk matrix. How do you use it?
As previously stated, a risk matrix will visually tell you the levels of risk that your organisation is facing. They are often used during the risk assessment process to help you decide which risk management strategy will be best to deal with them as well as which risks need prioritising. The risk matrix can be interpreted as follows:
- Green risks – The risk here is low, so risks can usually be accepted. Risk avoidance or mitigation actions are likely not necessary.
- Yellow risks – The risk here is medium, so you should consider risk mitigation actions to reduce or resolve the consequences.
- Red risks – These are exceptionally high risks, so adopting a strategy that eradicates them, such as risk avoidance, is a likely course of action.
You can also use a risk management matrix when reporting upon risks, which is an important element of the risk management process. Risk matrices are useful for communicating, easily and visually, the risks that your organisation faces and the levels of those risks. They may therefore come in handy when sharing risk assessment information with others in the business, either on their own or as a risk heat map in a wider risk report.
Remember to keep your risk matrix up to date so that it remains a useful, accurate tool.
Risk matrices: a controversial tool
While risk matrices can bring many benefits to your risk management processes, they are not without their drawbacks. It's important to be aware of both the pros and cons of risk matrices before you leap into using one.
The pros:
- They present complex data in a clear, accessible way
- Organisations can customise them as appropriate for their specific situations
- They highlight which risks should be prioritised
- By being easy to use and understand, they can make your risk management processes more transparent
- They are an effective method of presenting risk data
The cons:
- The risk matrix categories may not be specific enough to accurately compare and differentiate between levels of risk
- They can lead to poor decision making if risks are categorised incorrectly
- Categorising the severity and likelihood of uncertain risks is often subjective and therefore not totally reliable
- They are often oversimplified
- They do not consider timescales and how risks may change over the years
So, should you use a risk matrix?
There are strong arguments for and against using a risk matrix. On the plus-side, they are a great tool for helping you assess and present levels of risk in a concise and visual way. They are also relatively straightforward to create – you simply identify risks, evaluate them, input them into the matrix, and monitor them. Their visual nature also means that they are valuable when reporting information. By presenting levels of risk using a colour-coded, traffic-light system, they can be understood almost in an instant.
However, their limitations must too be recognised. Depending on the risks you are dealing with, your risk matrix categories may be insufficient to properly differentiate between levels of risk. This is made even trickier when the categories are often subjective. What's more, since timescales are not considered within the risk matrix itself, your risk matrix will need to be regularly checked.
It would be fair to say that the simple nature of the risk matrix is both its greatest benefit and greatest weakness. Their simplicity makes for a great overview of levels of risk, but it also means that nuances are left out, which can negatively impact upon decision making.
It is useful to consider what other measures you can implement, in addition to a risk matrix, in order to ensure that your risk management process is robust. Risk management software, for example, can support your approach by holding your risk register, scoring and reporting in one place.
Now that you understand what a risk matrix is, find out how Ideagen Risk Management can bring your risk register, risk matrix and heat maps together.
Explore risk management solutions
Roll up your risk into one system for full visibility, maximum control coverage and joined-up reporting.