




Is CEO pay at large US companies still going up? Three years of Ideagen Audit Analytics and MyLogIQ CompanyIQ data (2023 to 2025) for the S&P 500, the NASDAQ 100 and the Russell 1000, including each company's disclosed pay ratio, say yes, and at a faster rate than pay for the typical employee. The median also hides the more interesting story, because the biggest gains landed at the top of the pay scale and with CEOs who kept their jobs.
| Stat | Caption |
|---|---|
| $17.7M | S&P 500 median CEO pay in 2025 |
| $21.0M | S&P 500 median CEO pay in 2025 |
| $14.0M | Russell 1000 median CEO pay in 2025 |
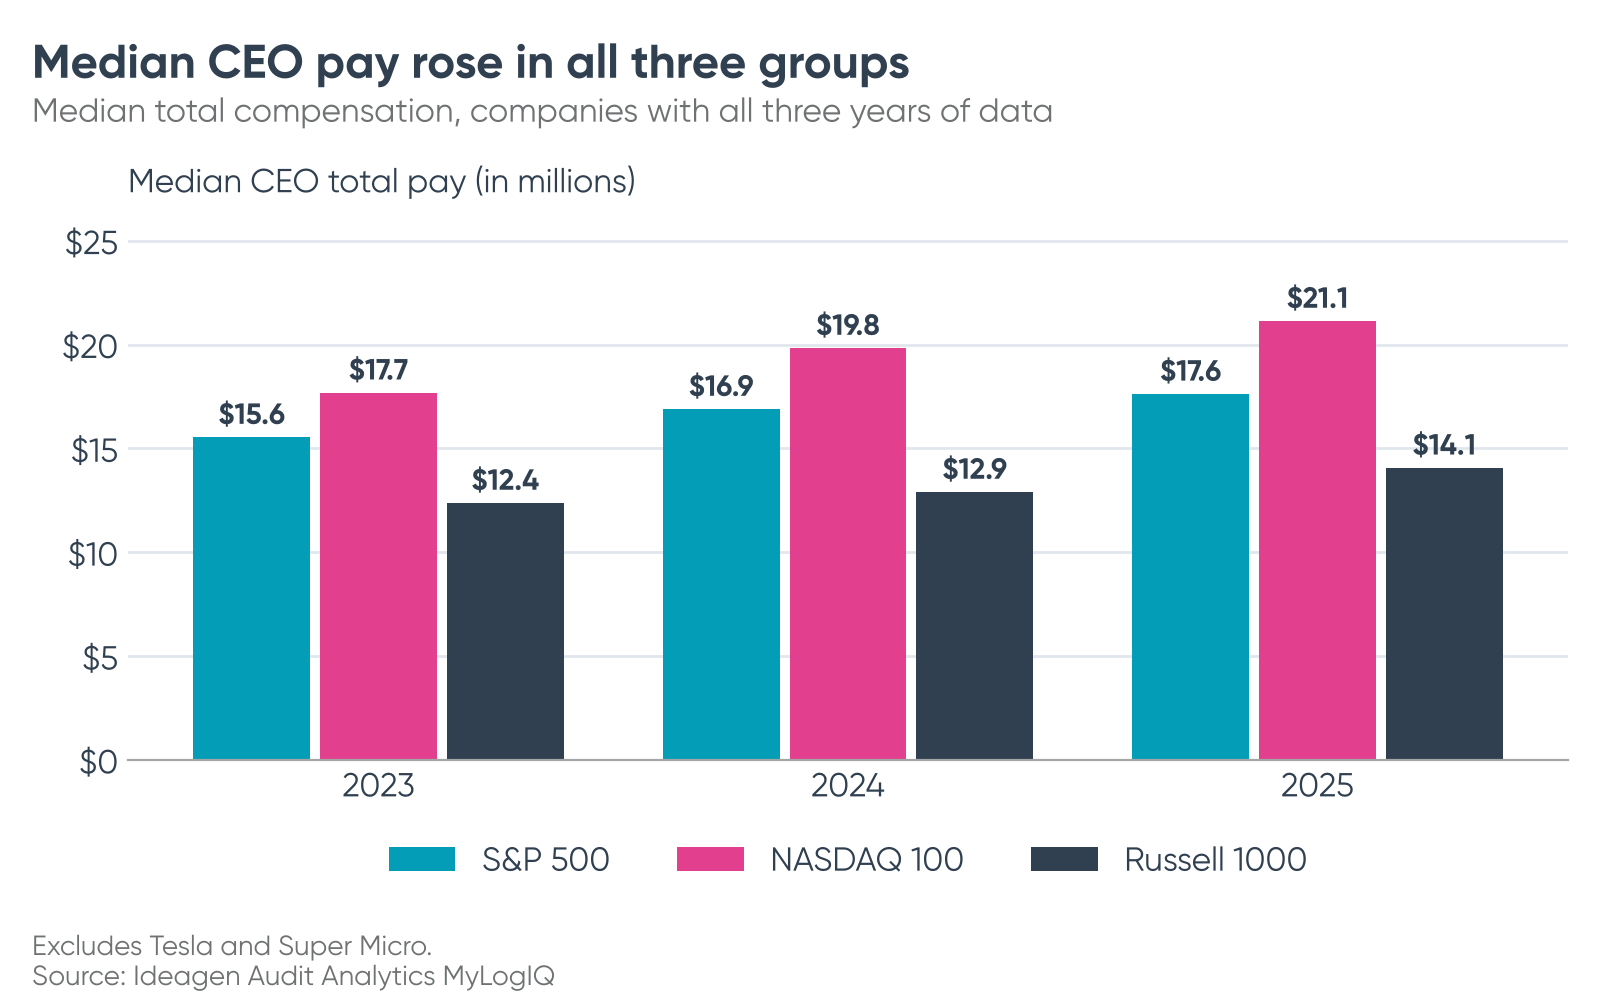
The median rose in all three groups
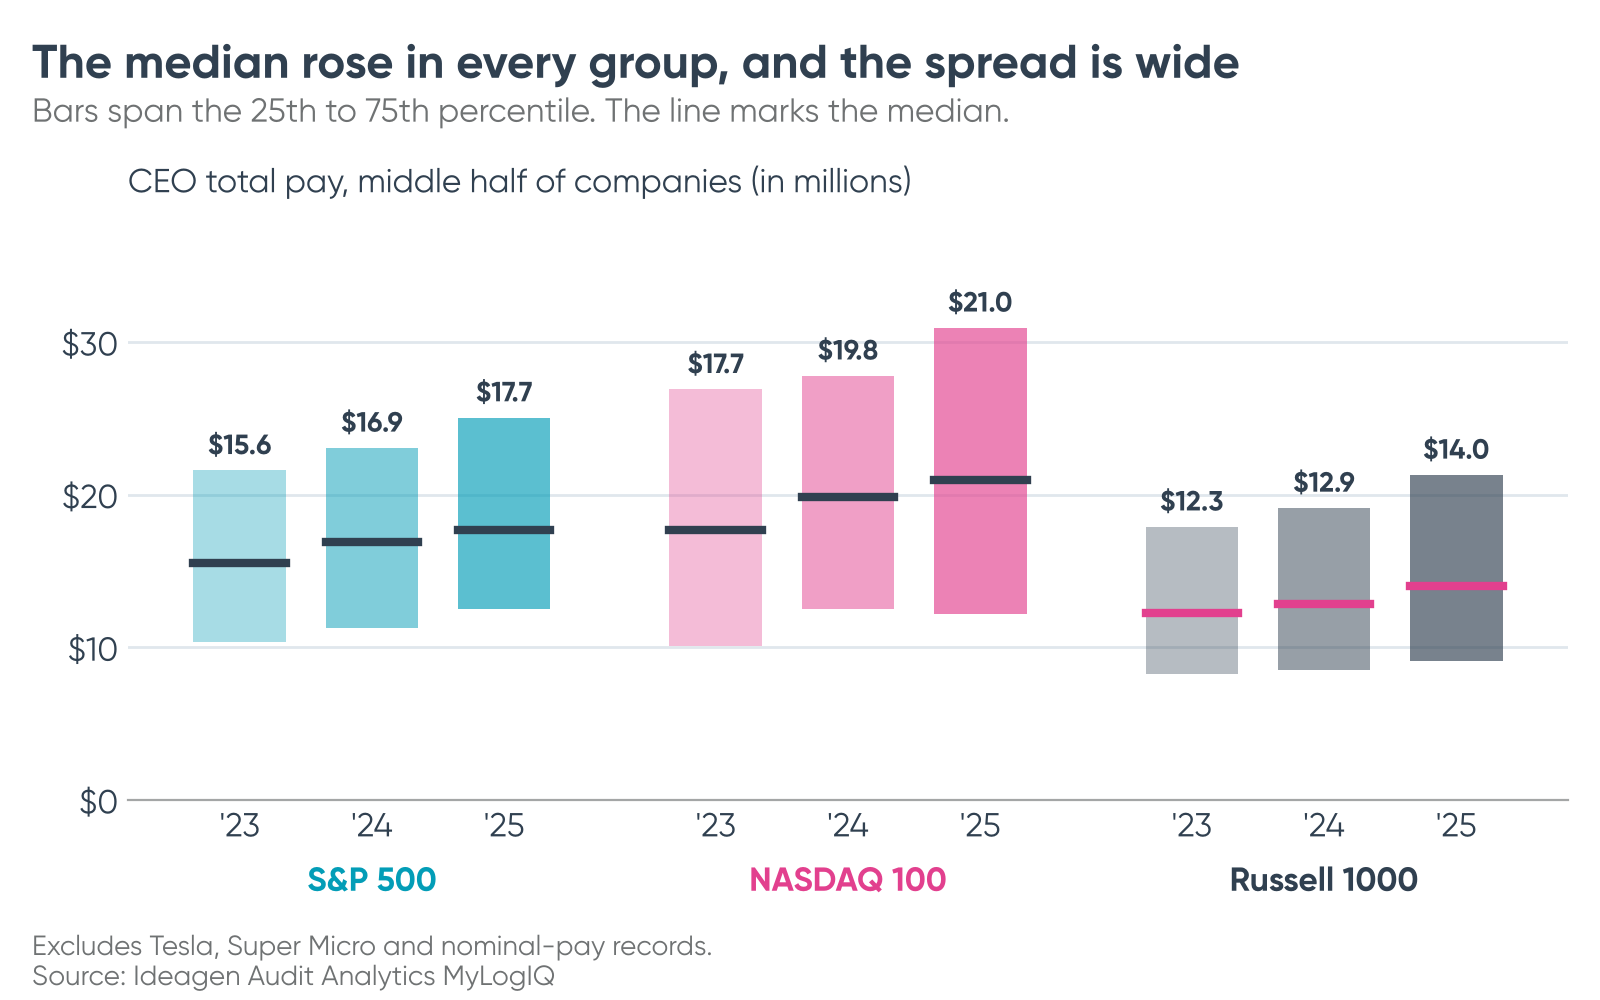
Among companies with all three years of data, median CEO pay in the S&P 500 rose from $15.6 million in 2023 to $17.6 million in 2025, a gain of 13.4%. The NASDAQ 100 started higher and climbed faster, from $17.7 million to $21.1 million, up 19.5%. The Russell 1000 median rose from $12.4 million to $14.1 million, up 13.7%.
The timing differed. In the S&P 500 the gain slowed from 8.7% in 2024 to 4.3% in 2025, and in the NASDAQ 100 from 12.2% to 6.6%. The Russell 1000 went the other way, from 4.3% to 9.0%.
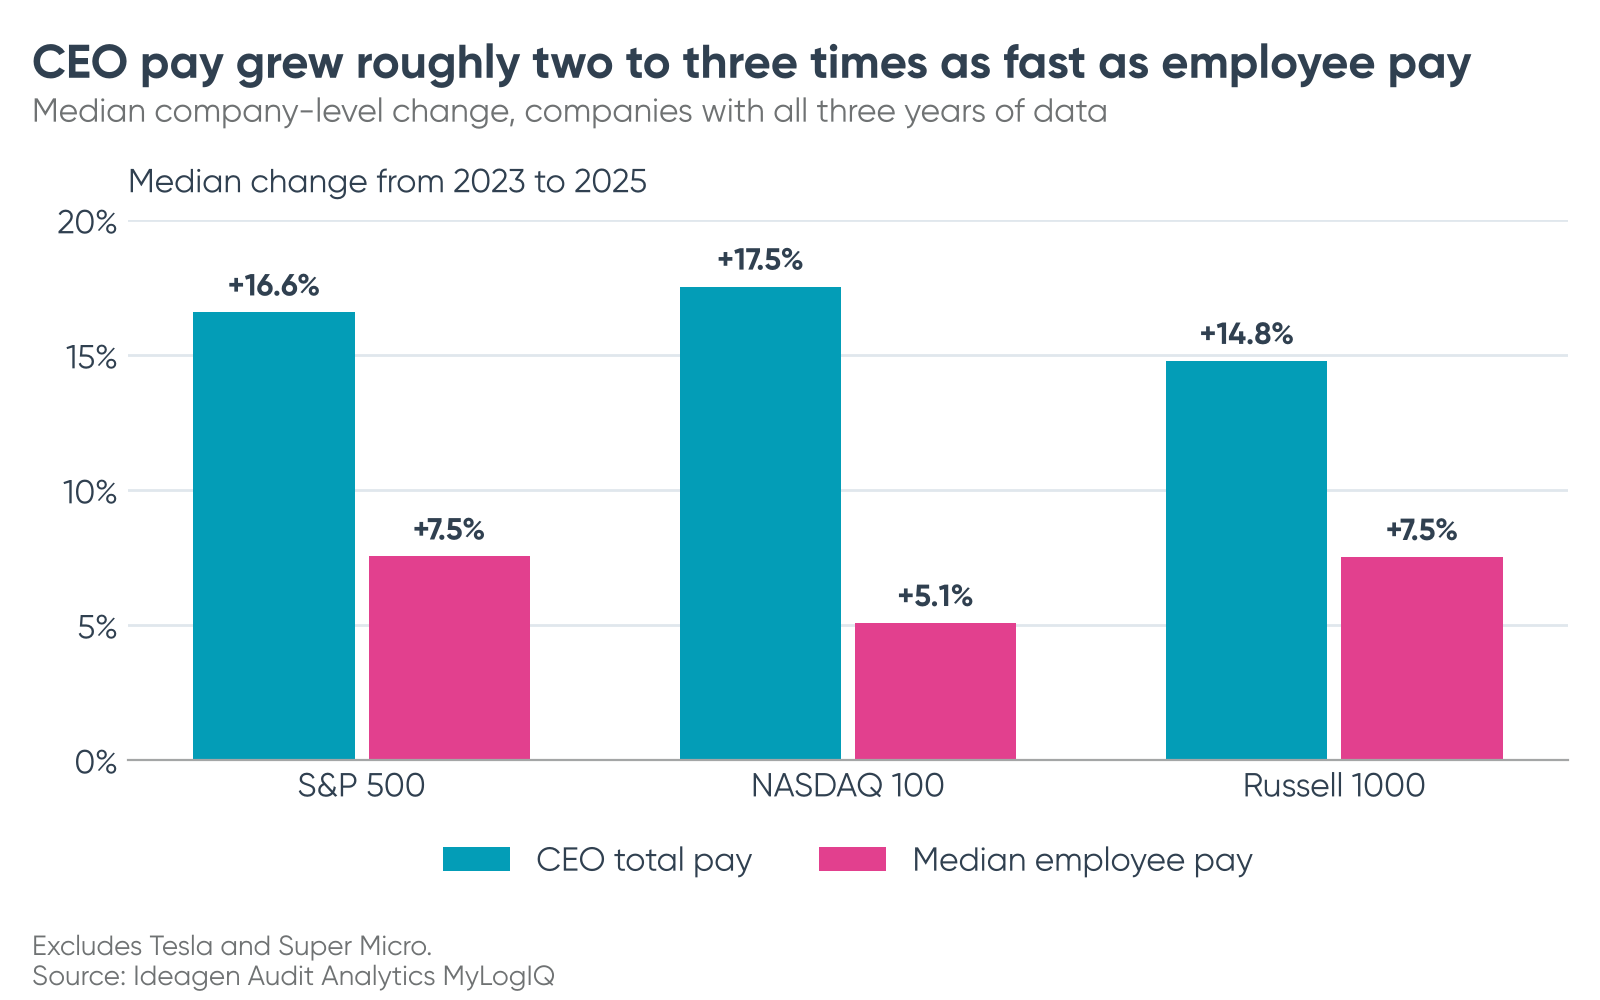
CEO pay grew roughly two to three times as fast as employee pay
Pay ratio disclosures allow a comparison of CEO pay with pay for each company's own median employee. For companies with all three years, the median CEO gained 16.6% from 2023 to 2025 in the S&P 500, against 7.5% for the median employee. The NASDAQ 100 showed 17.5% against 5.1% and the Russell 1000 showed 14.8% against 7.5%. CEO pay rose roughly twice as fast in the S&P 500 and the Russell 1000, and more than three times as fast in the NASDAQ 100.
The pay ratio is a company's CEO total pay divided by the pay of its median employee. Public companies disclose it each year under SEC rules (Item 402(u) of Regulation S-K). The median company ratio barely moved in the S&P 500 and the Russell 1000, and it jumped in the NASDAQ 100 in 2025. Because the ratio compares one level with another, it is sensitive to which companies sit in the middle, and the NASDAQ 100 figure rests on a small group of companies, so that jump deserves caution.
| Group | Median pay ratio 2023 (CEO to employee) | Median pay ratio 2024 | Median pay ratio 2025 | Median employee pay 2025 (dollars) |
|---|---|---|---|---|
| S&P 500 | 186 | 188 | 190 | $89,867 |
| NASDAQ 100 | 184 | 175 | 217 | $114,331 |
| Russell 1000 | 151 | 153 | 154 | $85,845 |
Source: Ideagen Audit Analytics MyLogIQ. Excludes Tesla and Super Micro.
Averages move faster than medians
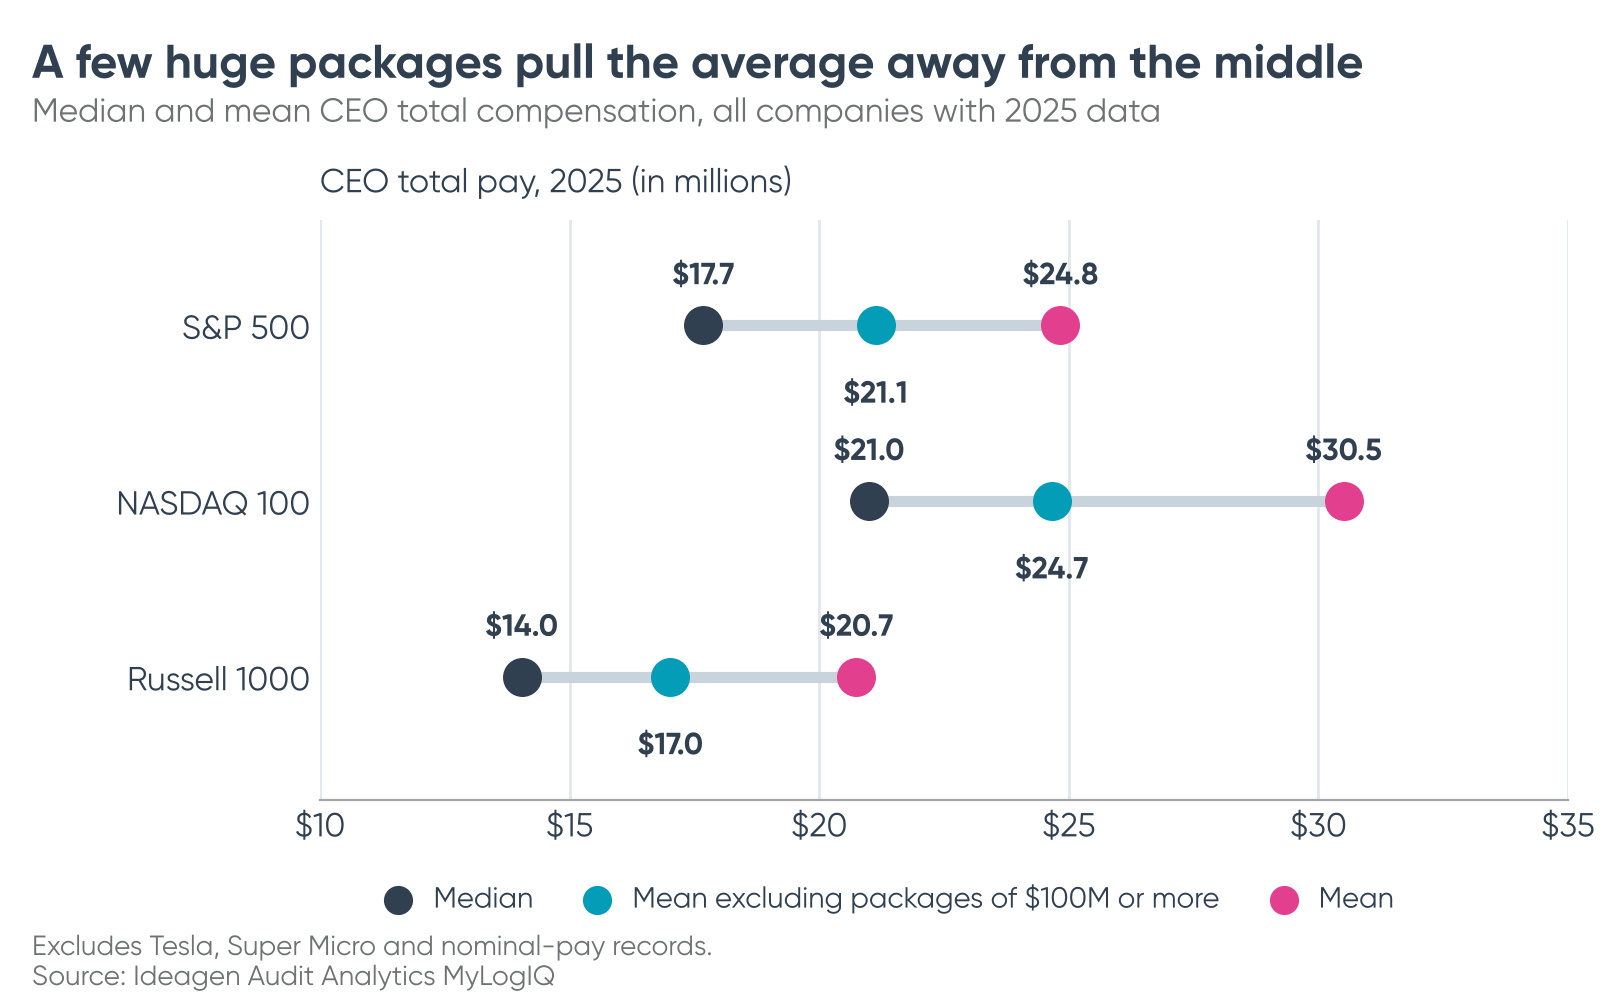
Average pay tells a bigger story. The average S&P 500 CEO earned $18.6 million in 2023 and $24.8 million in 2025, a gain of 33.7% against 13.7% for the median. A handful of very large packages drive the gap. Six S&P 500 records of $100 million or more in 2025 (Welltower, Oracle, CrowdStrike, Broadcom, Blackstone and Goldman Sachs) account for about 16% of the 2025 average. Without them it is $21.1 million. Oracle's figure averages its two co-CEOs.
The NASDAQ 100 average rose 26.8%, from $24.1 million to $30.5 million. Three companies (Broadcom, CrowdStrike and Warner Bros. Discovery) account for 21.8% of the 2025 average, which falls to $24.7 million without them.
The Russell 1000 shows the widest gap. Its average rose 39.0%, from $14.9 million to $20.7 million, against 14.4% for the median. Ten companies in 2025, up from five in 2023, account for 18.9% of the 2025 average, which falls to $17.0 million without them.
The top end is moving faster than the middle
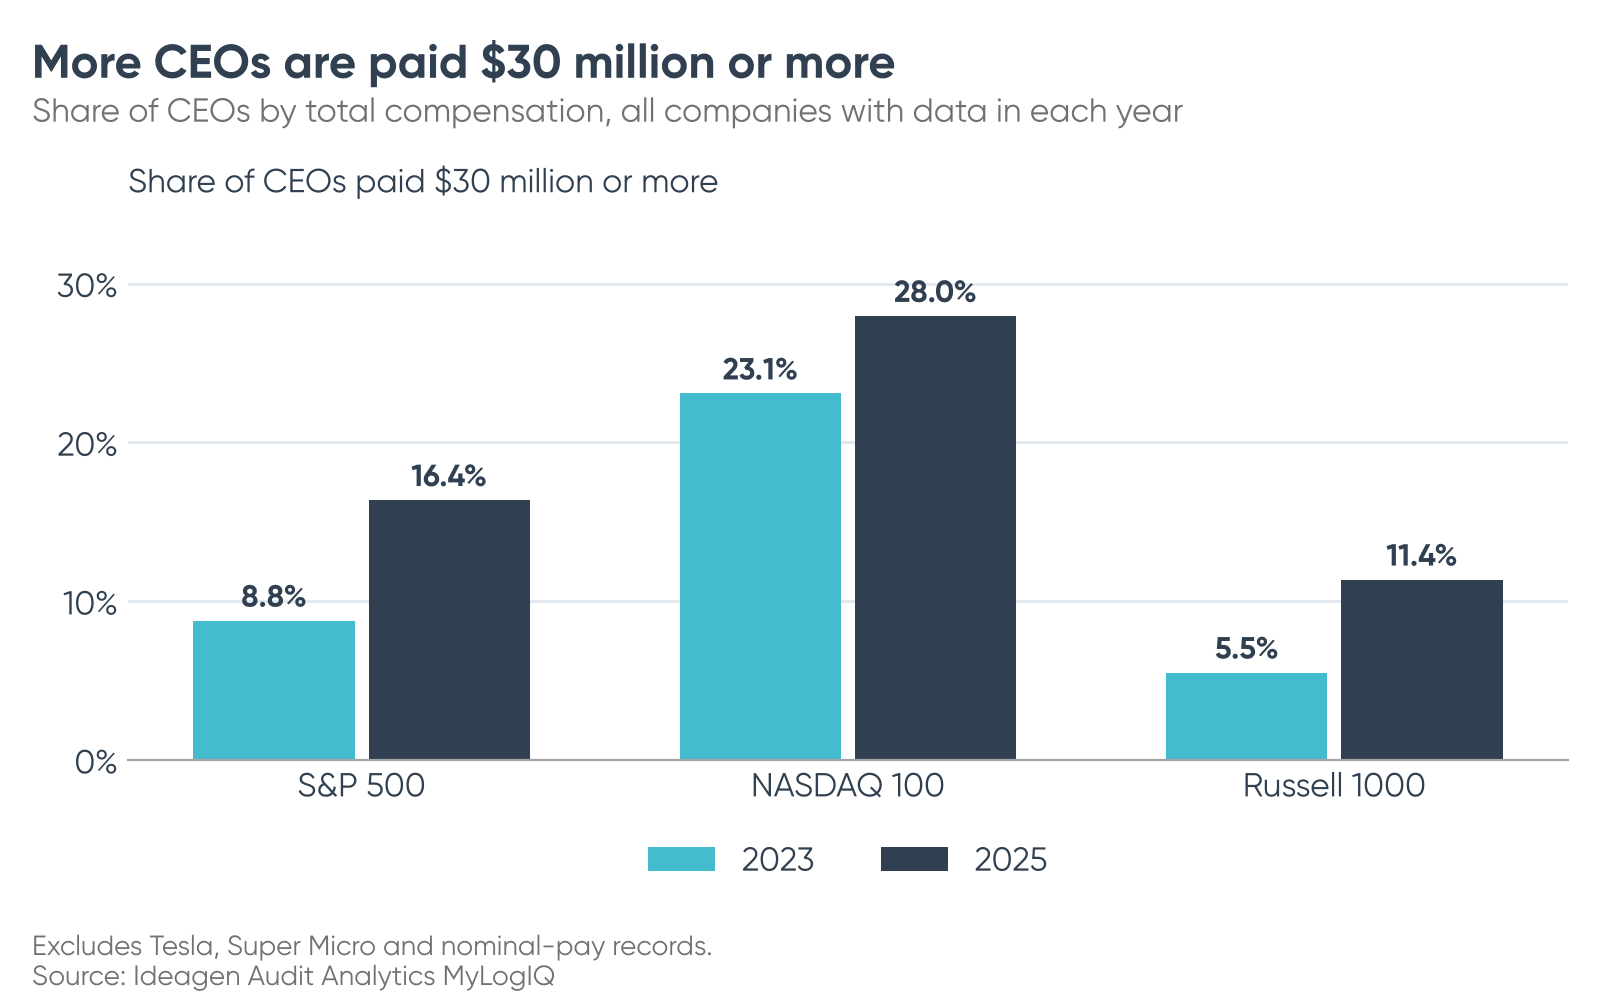
In the S&P 500, the share of CEOs paid $30 million or more roughly doubled, from 8.8% in 2023 to 16.4% in 2025. The share at $50 million or more more than doubled, from 2.7% to 6.5%. The NASDAQ 100 shows the same pattern from a higher base: 23.1% to 28.0% at $30 million or more, and 6.6% to 15.1% at $50 million or more.
The Russell 1000 doubled from the lowest base. CEOs paid $30 million or more went from 5.5% to 11.4%, and those at $50 million or more went from 1.6% to 4.3%. A median can look calm while the upper tail does most of the moving.
The raises went to sitting CEOs
Did a change of CEO explain any of this? Among companies with all three years of data, splitting them by whether the same executive appeared in all three years points one way.
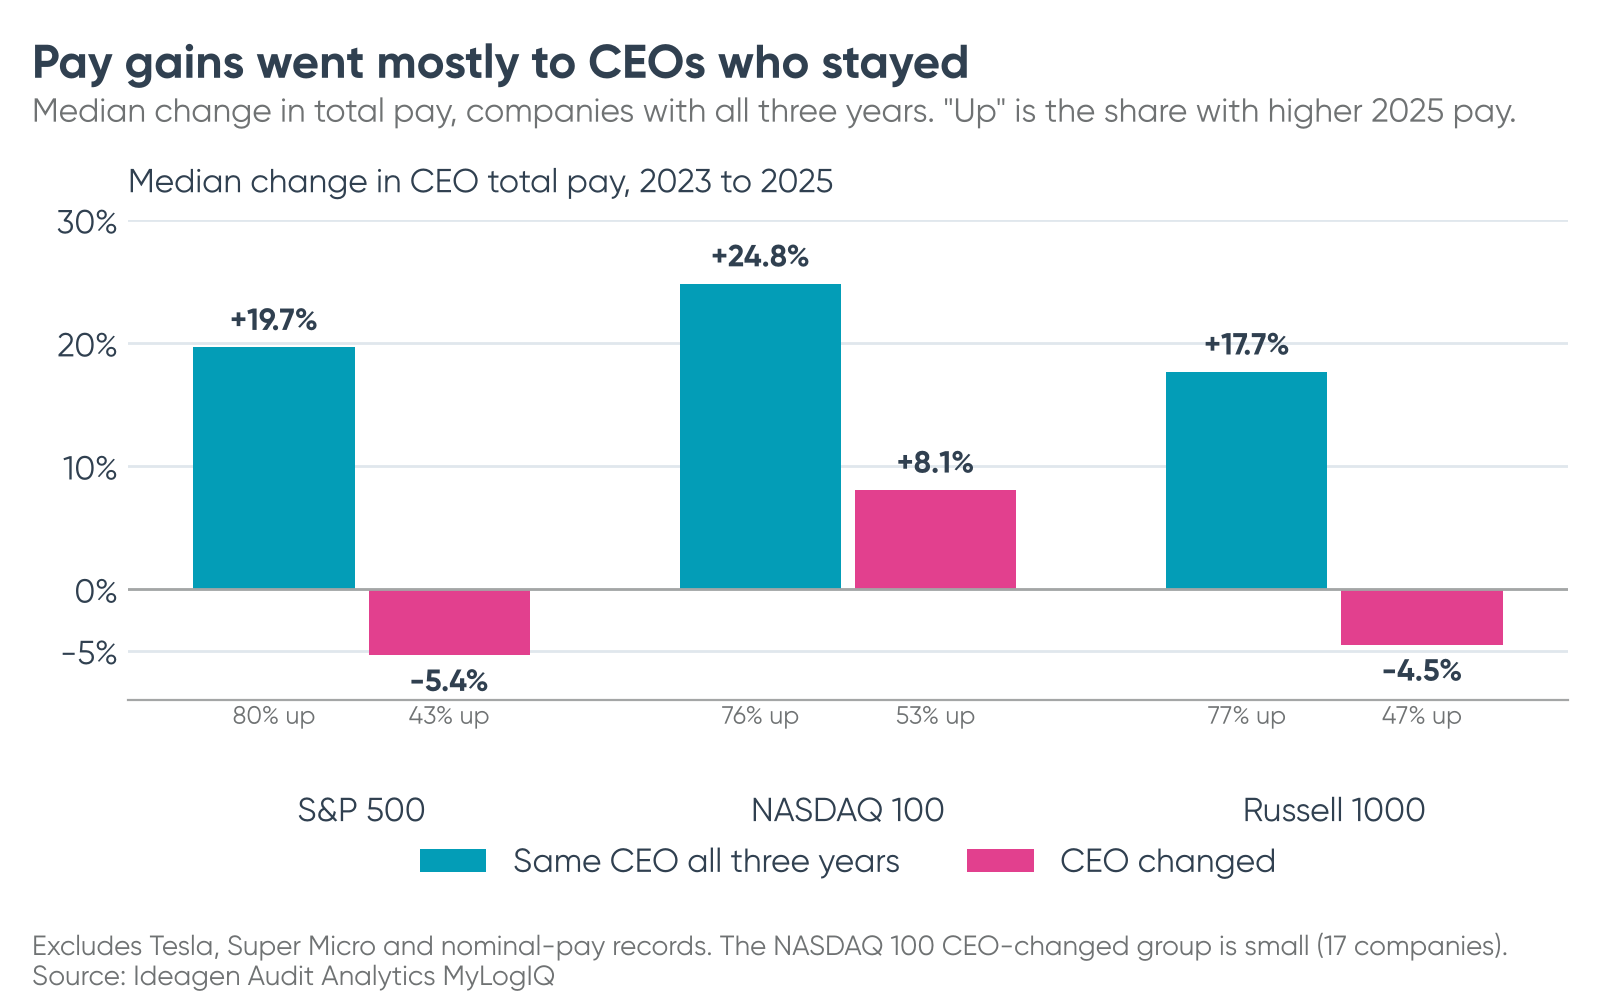
In the S&P 500, companies with the same CEO throughout showed a median pay increase of 19.7% from 2023 to 2025, and 80.1% of those CEOs earned more in 2025 than in 2023. Companies that changed CEOs showed a median decline of 5.4%, and only 43.4% of those records went up. The Russell 1000 looked much the same: +17.7% for companies with the same CEO and a 4.5% decline for those that changed. The NASDAQ 100 pointed the same way (+24.8% and +8.1%), though the group that changed CEOs is small.
An incoming CEO may reset pay below the predecessor's level, but the data cannot say why.
More of the pay is stock
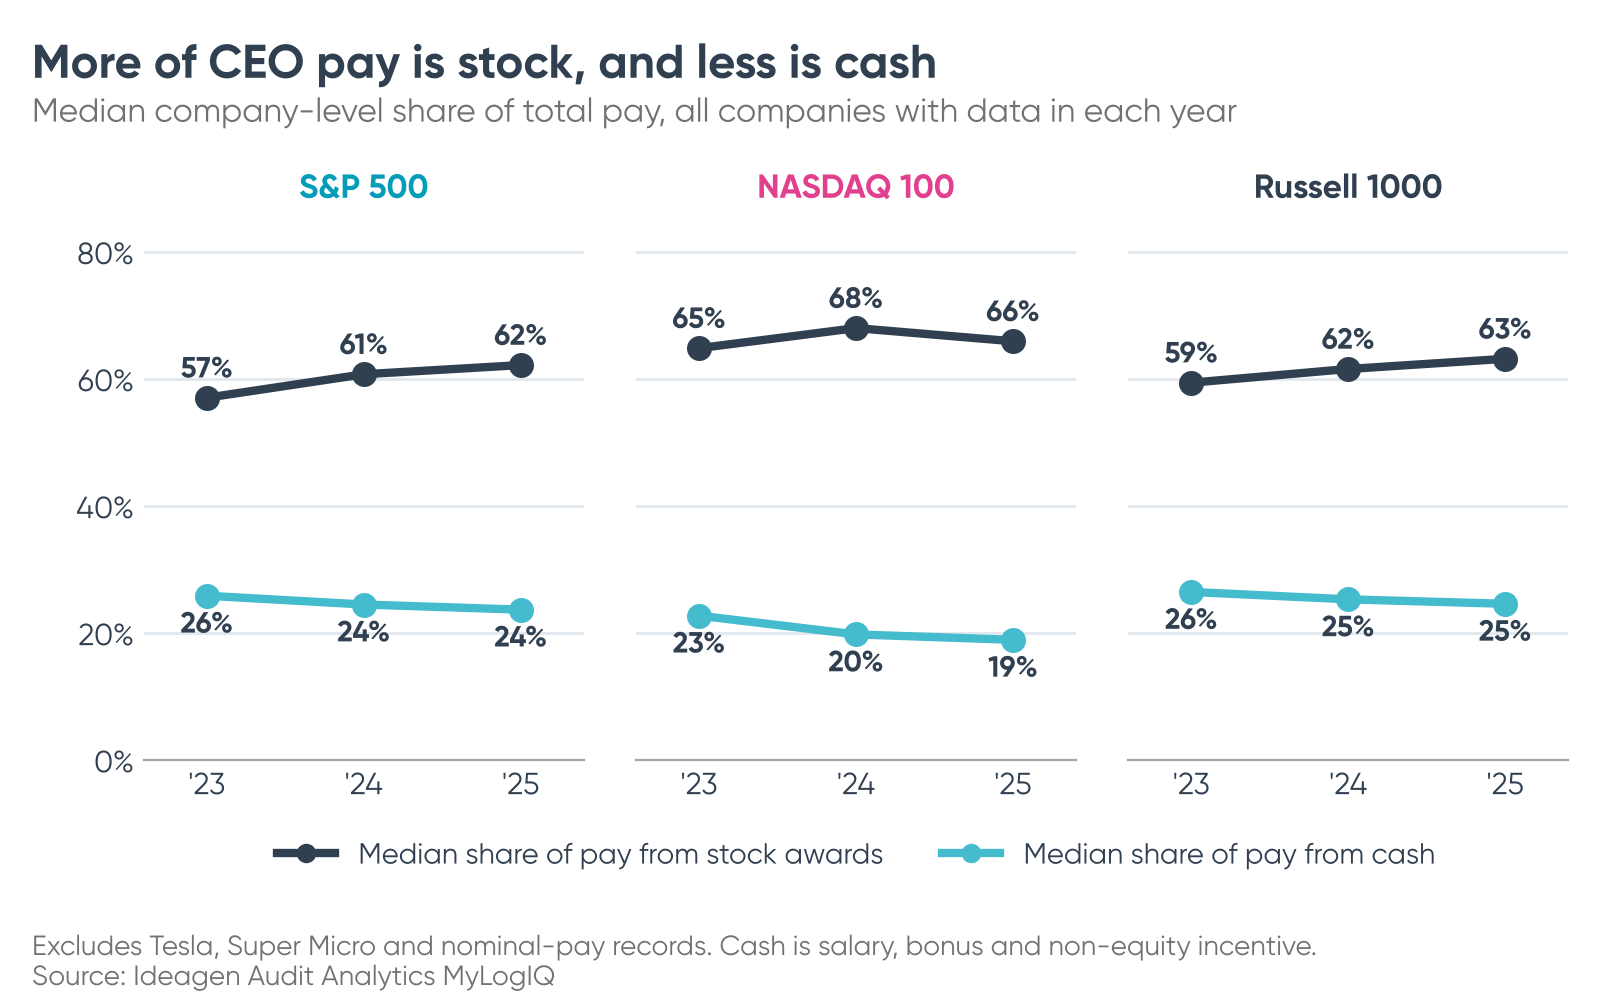
The mix is shifting as well. The median S&P 500 CEO received 57.0% of total pay as stock awards in 2023 and 62.2% in 2025, while the cash share (salary, bonus and non-equity incentive) slipped from 25.9% to 23.7%. The Russell 1000 moved the same way, from 59.4% to 63.2% in stock and from 26.5% to 24.6% in cash. NASDAQ 100 CEOs rely most on stock and least on cash, though their stock share peaked in 2024 (68.0%). The share of CEOs with any option award fell in all three groups.
What the data suggests
CEO pay in these three groups rose over three years, and the evidence points to two things: CEOs pulled ahead of their employees, and the gap widened between the top and the middle rather than lifting everyone evenly. Technology and communications pay leads on median CEO total pay, although services show the greatest ratio difference between CEO and median employee.
Methodology
Population: CEO records for compensation years 2023 to 2025 for the S&P 500, NASDAQ 100 and Russell 1000 from Ideagen Audit Analytics MyLogIQ. Trends use companies with all three years. Tesla and Super Micro are excluded from every statistic: Tesla reports zero pay in 2023 and 2024 and $158.4 billion in 2025, and Super Micro reports $1 in fiscal 2023 and $442 in fiscal 2025. Records with total compensation under $1,000 are also excluded. Where a company reported co-CEOs, the records were averaged into one company-year; where a former CEO appeared alongside the current CEO, the current CEO was kept. Medians and averages are company-level. Fiscal years follow the MyLogIQ convention: a fiscal year ending before July 1 is assigned to the prior year, and a fiscal year ending on or after July 1 is assigned to the current year.
Explore audit and regulatory disclosure data
Expert data you can trust – and find within seconds. Your go-to place for public accounting, governance and disclosure intelligence.